Table of Contents
- 21.1. Introduction
- 21.2. Creating and formatting basic Windrose graphs
- 21.3. Formatting the plot
- 21.3.1. Positioning the plot
- 21.3.2. Specifying the size of the plot
- 21.3.3. Specifying the size of the Zero-circle (middle circle)
- 21.3.4. Formatting the plot legend
- 21.3.5. Adjusting the grid colors
- 21.3.6. Adjusting the weight of the grid circles
- 21.3.7. Adding a box around the plot
- 21.3.8. Adjusting the size of the center zero circle
- 21.3.9. Localizing the default names for the compass directions
- 21.3.10. Adjusting the formatting of the windrose plot legs
- 21.4. Some more advanced formatting
- 21.5. Adding icon and text objects to the graph
- 21.6. Using layout classes to position Windrose plots
- 21.7. Example section
Note
This module is only available in the pro-version of the library.
Windrose plots are usually used to display values which are related to compass directions. For example it could be used to illustrate measured wind strengths over a time period in different directions. Figure 21.1 Illustrates a basic example of a windrose graph with one windrose plot.
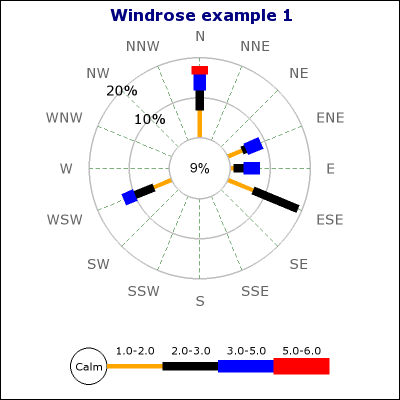
Windrose plots puts data in a number of ranges (or buckets). The number of data points in a certain bucket is visualized by the length of the particular bucket in that direction. The input data specifies the percentage of the overall data that belongs to one bucket in one specific direction. By default there are eight buckets with ranges shown in Table 21.1. The default ranges that is shown in the legend is standard values used in displaying wind strengths. The values in the legend (for the buckets) is purely informational since the actual display is controlled by the input data that only specifies a bucket number and not any absolute data values. See more on how to specify input data in ??
Table 21.1. Default windrose buckets
| Bucket nr | Range of values |
|---|---|
| 0 | [0,1] |
| 1 | [1,2] |
| 2 | [2,3] |
| 3 | [3,5] |
| 4 | [5,6] |
| 5 | [6,10] |
| 6 | [10,13.5] |
| 7 | [13.5,99] |
Note
The default fonts for Windrose graphs are TTF fonts. This means that to run the examples exactly as shown in this chapter TTF fonts must be installed. If TTF fonts are not available then the font needs to be changed to one of the built-in fonts.
Windrose plots also supports full image anti-aliasing to enhance the look and feel of the graph. The image in Figure 21.1 is using anti-alias.
Caution
To use anti alias TTF fonts must be enabled and used.
The Windrose extension module supports all the usual library graph capabilities like frames, shadows, colors, titles, cache. Some of the additional Windrose graphs capabilities are:
Enhanced anti-alias capability for smooth looking graphs
Manual or automatic scale
Supports customizable compass types which allow you to choose between 16,8 and 4 compass directions to be shown.
Supports two types of basic graphs; Free direction graphs and compass bound graphs.
Allows data to be specified with both compass direction and angles (in degrees)
Fully customizable fonts everywhere in the plot
Fully automatic adaptive positioning of the labels for the scale to avoid collision with data. This can also be turned off to allow manual positioning of the labels.
Labels have extensive formatting capabilities and supports background colors, rounded boxes and arbitrary fonts.
Supports multiple Windrose graphs on the same image
Fully customizable size and positioning of each individual windrose graph.
Size of windrose plots can be specified both as absolute pixels or as fraction of the graph size.
Both manual and automatic color specifications
Both automatic and manual scaling
Intelligent positioning of angle labels with possibility for client specification of alignment type.
Windrose graphs may have arbitrary texts blocks added to the graph
There are two basic types of Windrose plots:
Compass type.
This type of windrose plot has either 4,8 or 16 compass direction axis. Directions in input data is limited to one of the compass directions in the plot. The directions are specified as ordinal number of the direction axis.
The labels on the axis is by default short forms of the compass directions, for example, "E", "N", "W", "S". (See ?? for how to alter the default names of the compass directions). The ordinal number are counted anti-clockwise from East (3 o'clock).
Free type.
This type of windrose plot has no pre-defined direction axis. Directions in input data can be arbitrary angles (or specified as compass directions e.g. "NW"). The 0-angle corresponds to the East direction (3 o'clock)
To specify the type of plot to create the following method is used
WindrosePlot::SetType($aDirection)$aDirectionis one of the following 4 predefined constantsWINDROSE_TYPE4, Compass type with the four core compass directionsWINDROSE_TYPE8, Compass type with eight directionsWINDROSE_TYPE16, Compass type with sixteen directionsWINDROSE_TYPEFREE, Free type. Data directions can be arbitrary angles and there are no predefined labels nor any predefined axis.
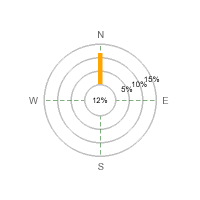
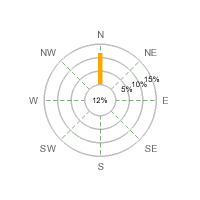
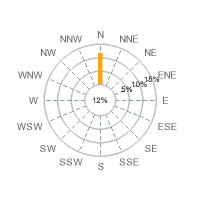
The figures below illustrates the basic principle of the different types of windrose plots
|
|
|
|
|
|
The following line would specify a Windrose plot with all 16 compass angles
1 2 3 4 | $wp = new WindrosePlot($data); $wp->SetType(WINDROSE_TYPE16); |
Note
If no type is specified the plot type will default to a compass type with 16 directions
Input data is in the form of a data array. Each entry in the array is itself an array which gives the data for one direction. The data should be interpreted as the percentage of the overall data that belongs to a certain direction and bucket. This also means that the total sum of all data entries (for all doirections) must be less or equal to 100. It can however be less than 100 (indicating that some data is lost).
The first bucket, bucket 0, specifies the 0-value, i.e. what part of the data in that direction that has no measurement (e.g. it was wind still). Since wind still has no direction all specified bucket 0 are summarized and displayed in the inner circle.
By default the ranges displayed on the legend are:
0-1, 1-2, 2-3, 3-5, 5-6, 6-10, 10-13.5, 13-99
This means that the first element specify the percentage of 0-1 reading the sum of these reading will be placed in the center of the windrose plot. The second element specifies the percentage of 1-2 readings, the third element the percentage of 2-3 readings and so on.
The direction is specified as the key for that element. The direction can be specified as either
A string specifying any of the displayed compass directions, e.g. "N", "SW".
$data = array ( array('E' => <east_bucket0>,<east_bucket1> ... <east_bucketN> ),
                array('ESE' => <eastsoutheast_bucket0>, ... <eastsoutheast_bucketN> ),
                ....
                array('NE' => <northeast_bucket0>, ... <northeast_bucketN> ),
                array('ENE' => <eastnortheast_bucket0>, ... <eastnortheast_bucketN> ));
An ordinal number (integer) in the range 0-15 for regular plots which indicates the axis counting anti-clockwise from East. Please note that only displayed axis count. Ordinal number zero specifies the east direction
$data = array ( array(0 => <east_bucket0>,<east_bucket1> ... <east_bucketN> ),
                array(1 => <eastsoutheast_bucket0>, ... <eastsoutheast_bucketN> ),
                ....
                array(2 => <northeast_bucket0>, ... <northeast_bucketN> ),
                array(3 => <eastnortheast_bucket0>, ... <eastnortheast_bucketN> ));
A string indicating a number, e.g. '34.5' , please note that if the angle is a fraction it must specified as a string. The library will then automatically recognize that as a valid angle and treat it as expected. (The reason for this is that floating point numbers can't be used as keys in an associative array.)
$data = array ( array('12.5' => <bucket0>,<bucket1> ... <bucketN> ),
                array('22.1' => <bucket0>, ... <bucketN> ),
                ....
Within the same data set it is also possible to mix the styles.
Caution
The library makes no data validation apart from checking that the overall sum of the buckets can not be > 100%. It is up to the client to make sure that the data specified makes sense.
If you specify a direction in the data for a compass directions that is not displayed when using a regular Windrose plot you will get an error message to that affect.
Below are some examples of how to specify the data which should clarify how this works
Example 21.1. Examples of input data for compass (regular) Windrose plots
(Assuming we have all 16 axis displayed)
1 | $data = array( 'N' => array(2,5,6) ); |
This data array specifies reading in only one direction, "North", the number of 0-readings are 2 percent, number of 0-1 readings are 5 percent and the number of 1-2 readings are 6 percent.
1 | $data = array( 1 => array(2,5,6), 3 => array(6,3), 'NW' => array(3,2,2,2) ) |
This data array specifies readings in three directions. As shown it is possible to mix both ordinal number for the axis as well as the symbolic direction name. However, it is probably best to stick with one method at a time for clarity.
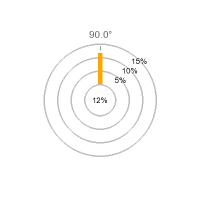
Example 21.2. Examples of input data for free Windrose plots
What is special with the free type is that angles are no longer restricted to only the 16 compass directions but arbitrary directions as well.
1 | $data = array( 10 => array(2,5,6), 24 => array(6,3), 137 => array(3,2,2,2) ) |
This data array specifies readings in three directions, 10 degrees, 24 degrees and 137 degrees.
1 | $data = array( '21.6' => array(2,5,6), 'N' => array(6,3), 137 => array(3,2,2,2) ) |
This data array specifies readings in three directions, 21.5 degrees, 'North' (or 90 degrees) and finally 137 degrees. Please note that in order to specify a fraction for an angle we must specify the direction as a string value, i.e. '21.6'. This will then be handled automatically be the library.