Note
This feature was added in 3.1.1p
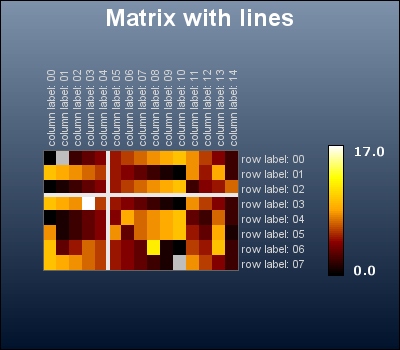
In order to mark important divisions in the plot it is possible to add an instance of
class PlotLine (either horizontal or vertical line) to each plot in the
graph. For example, to add one vertical and one horizontal plot line the following lines
can be added to the matrix script
1 2 3 4 5 6 7 8 9 10 11 12 13 14 15 | $mp = new MatrixPlot($data); // Create two lines to add as markers $l1 = new PlotLine(VERTICAL, 5, 'lightgray:1.5', 4); $l2 = new PlotLine(HORIZONTAL, 3, 'lightgray:1.5', 4); // Add lines to the plot $mp->AddLine($l1); $mp->AddLine($l2); // this could also be done as // $mp->AddLine(array($l1,$l2)); ... |
The example in Figure 22.11 shows an example of this